Exploratory Data Analysis - Credit Card Fraud
Overview
As billions of dollars of loss are caused every year due to fraudulent credit card transactions, the financial industry has switched from a case by case a posteriori investigation approach to an a priori predictive approach with the design of fraud detection algorithms to alert and assist fraud investigators. For an overview of data science for fraud detection and financial services, I have written a white paper available on this website. This project will focus on the step by step implementation of credit card fraud detection algorithms.
Business problem understanding
Being able to spot fraudulent activities in large volume of transaction such as the credit card uses can have the following benefits:
- decreasing money loss due to fraudulent transactions (direct loss and cashback)
- protecting the credit card business reputation
- safeguarding the public of unexpected owns credit card uses hence ensuring a better client satisfaction / customer relation In the same time, when detection fraudulent transactions, a trade-off has to be made so not to overflag transactions as fraud attempts while, in fact, they were legitimate as it may jeopardize the credit card company/customer relationship and have a huge operational cost with unnecessary investigations, and having to cancel legit credit cards then printing/posting new ones to the clients.
Data science goal
The volume and fast pace of credit card transactions makes it impossible to manually identify fraudulent transactions, so the aim is to create an automated fraud detection system.
Our Data
This set of data is available at https://www.kaggle.com/mlg-ulb/creditcardfraud as a unique table and is the result of a research collaboration of Worldline and the Machine Learning Group (http://mlg.ulb.ac.be) of ULB (Université Libre de Bruxelles) on big data mining and fraud detection.
Data structure
The data set is a limited record of transactions made by credit cards in September 2013 by European cardholders. It presents transactions that occurred in two days, with 492 frauds out of 284,807 transactions. The dataset is highly unbalanced as the positive class (frauds) account for 0.172% of all transactions.
Data dictionary
The data dictionary and data fields can be described as follow:
| Features | Description | Type |
|---|---|---|
| Time | Number of seconds elapsed between this transaction and the first transaction in the dataset | Numeric |
| Vi | with i in [1,28] | Numeric |
| Amount | Transaction amount | Numeric |
| Class | 1 for fraudulent transactions, 0 otherwise | Boolean |
In addition:
- The Vi are the results (components) of a PCA transformation
- Time and Amount were not transformed
When it comes to describing the Vi variables, no additional background information is provided due to confidentiality issues.
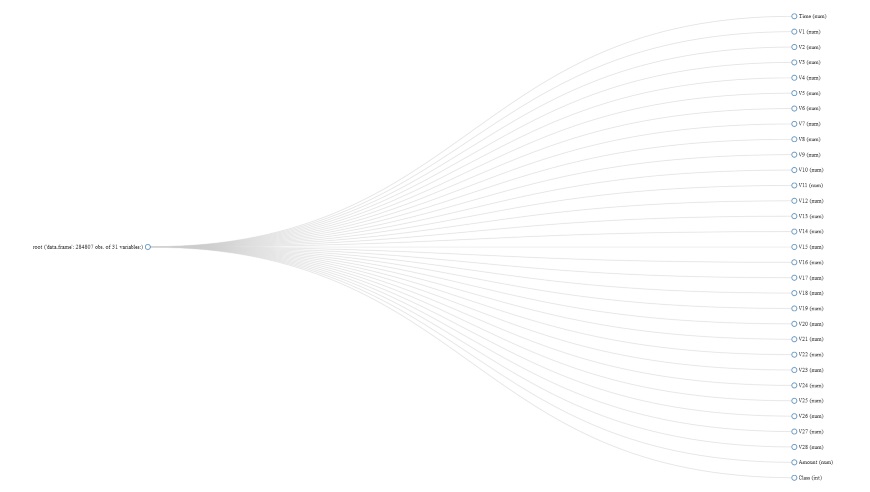
I have used plot_str to visualize the data structure in a D3 network graph.
Data summary
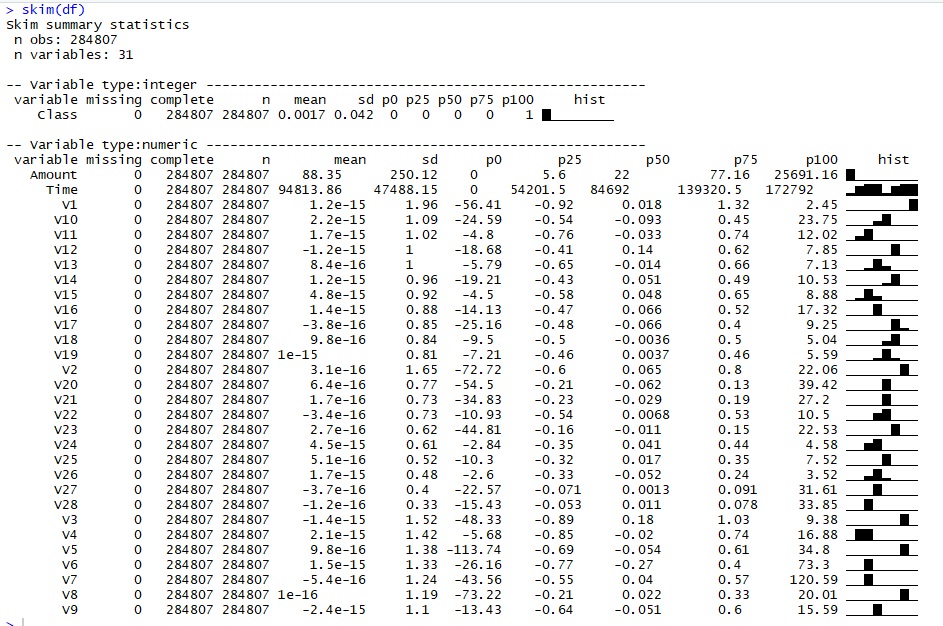
We create a summary using skimr of the different variables but as no additional background information is provided regarding the Vi, variable, the insights are limited.
Missing data
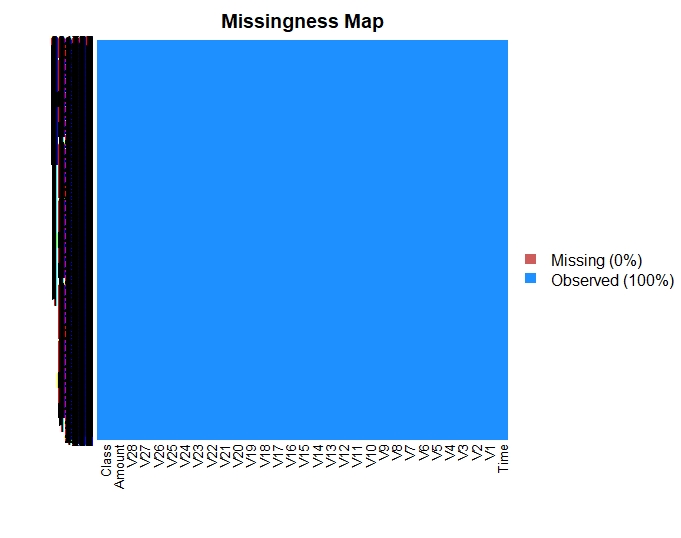
This dataset has no missing data as plotted below.
Univariate analysis
The input variables are: the 28 Vi, Time and Amount. Class is the labelled output.
Class is the output target
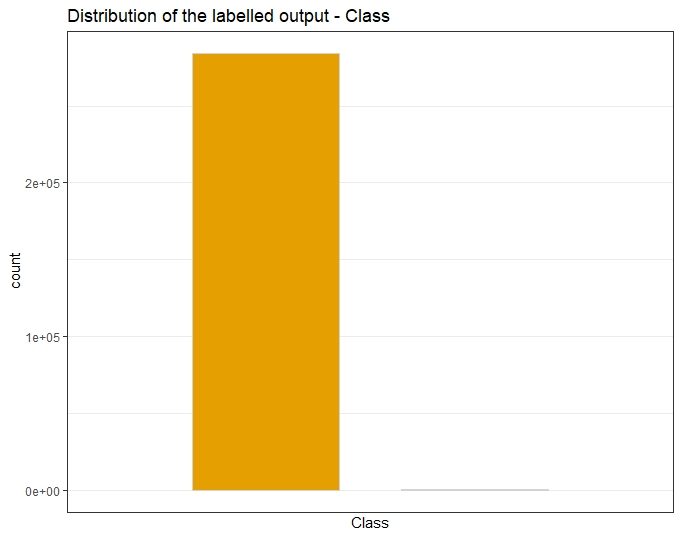
The class is our output target. When plotting legit and fraudulent transactions, we observe their ratio is imbalanced as legitimate transactions far outnumber the fraudulent ones. The positive class (frauds) account for 0.172% of all transactions.
Time
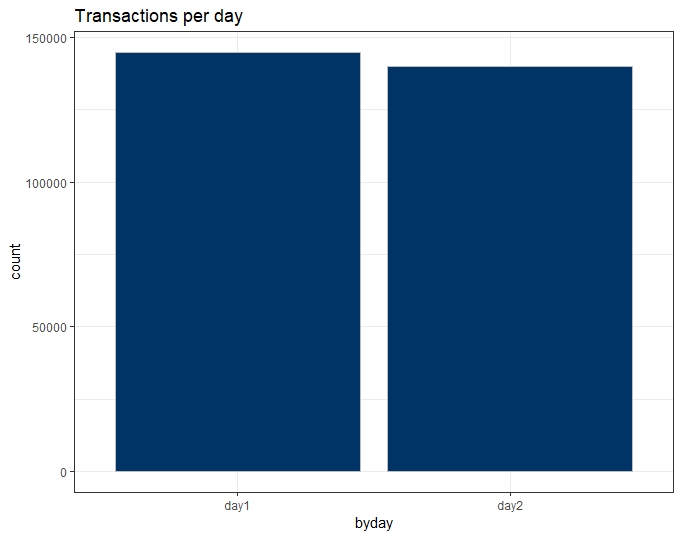
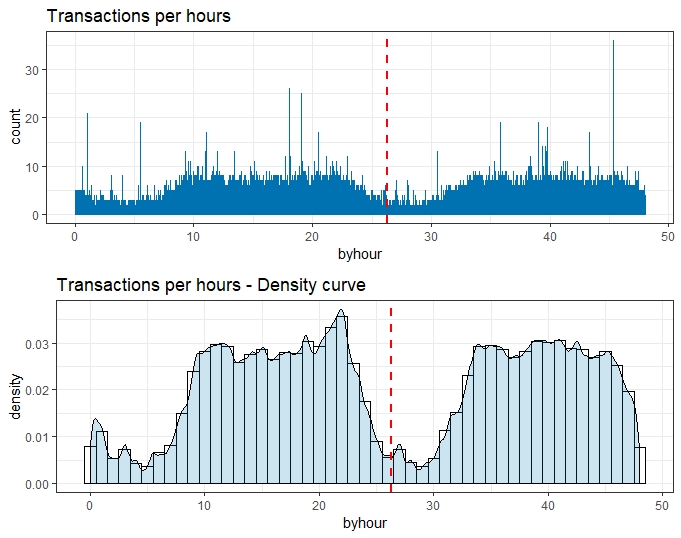
As per the dataset overview, the only information given regarding the Time variable is the timeframe as it groups transactions that occurred in two days.
We do not know if the 48-hour period is arbitrary or not. Because of the lack of context, we can also assume the data record we have start at midnight.
Below are given the plots by day and then by hour.
Amount
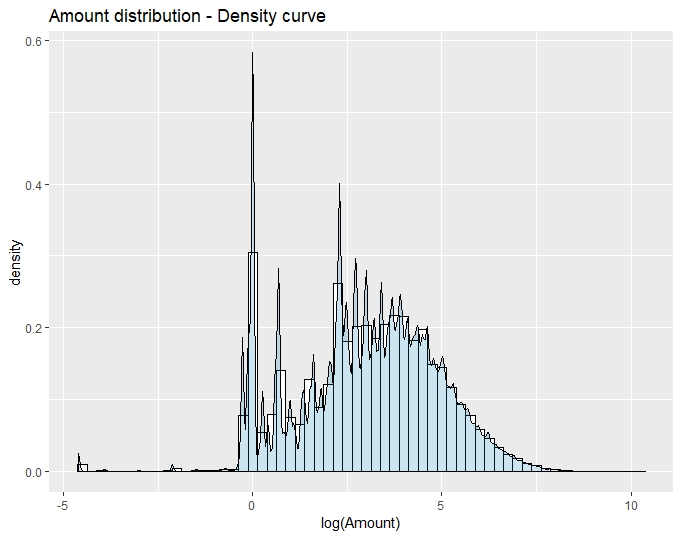
The Amount variable is not normalized unless other Vi variables.
Vi
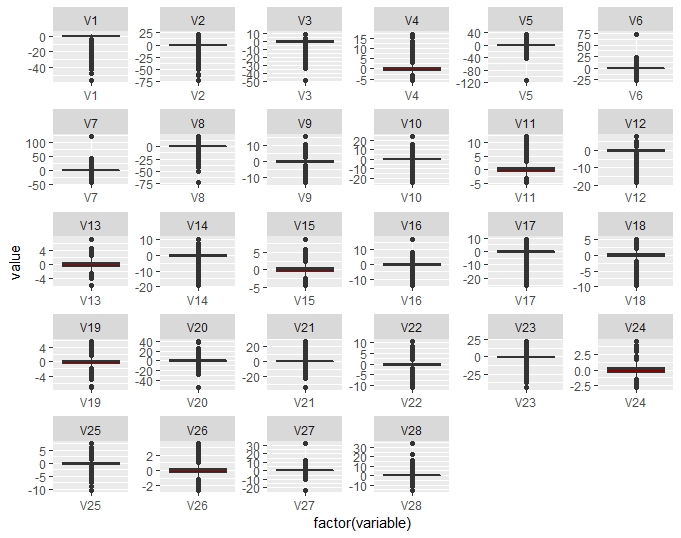
Plotting the distribution of Vi variables, they appear to have been normalised.
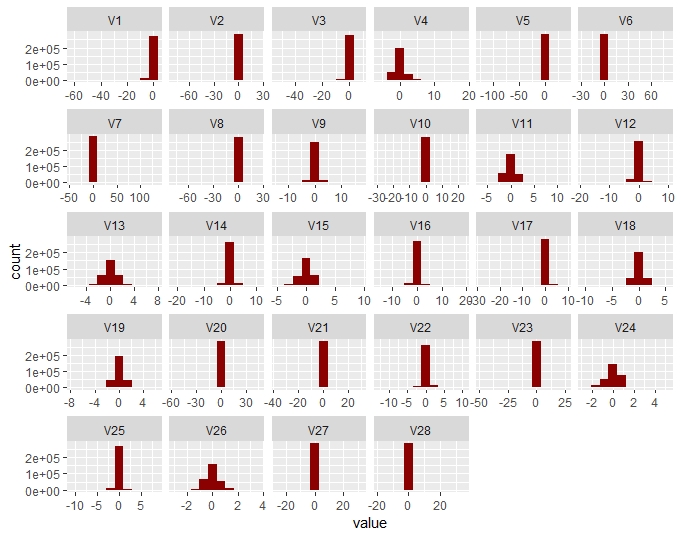 In addition, the boxplots help detect if there is any outliers.
Bivariate data analysis
Time vs Class
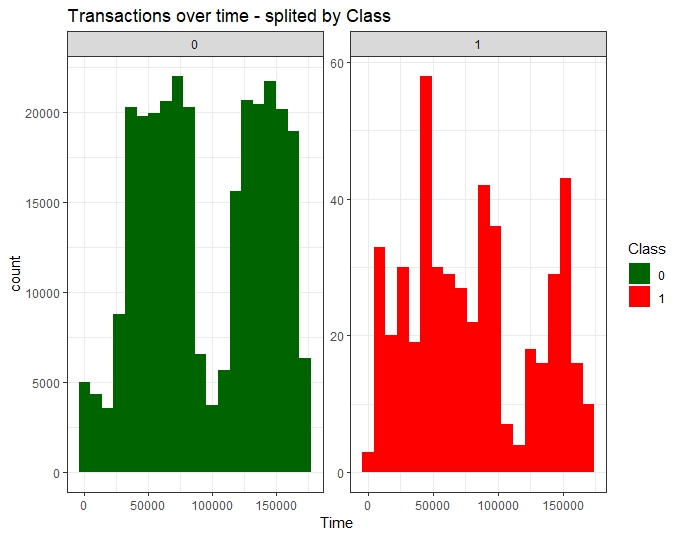
Fraudulent transactions have a distribution different from legitimate transactions, more equally distributed in time.
Amount vs Class
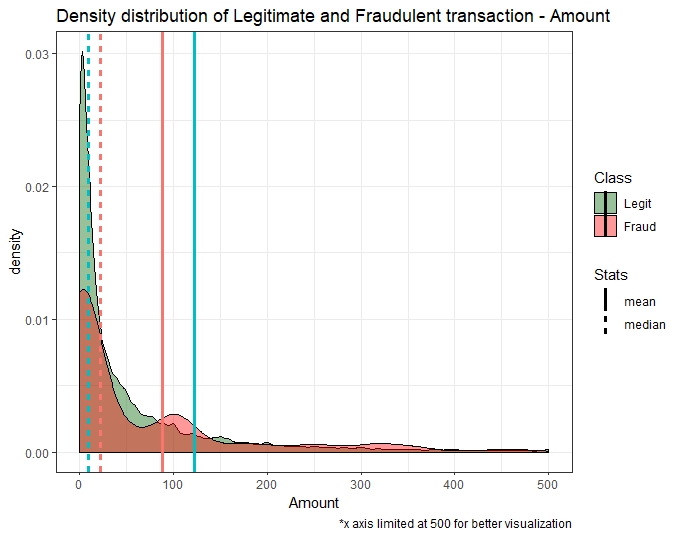
The transactions are under 2000 $ for most both fraud and normal transactions: fraud amount distribution is larger than with the non-fraud ones being under 1000 $.
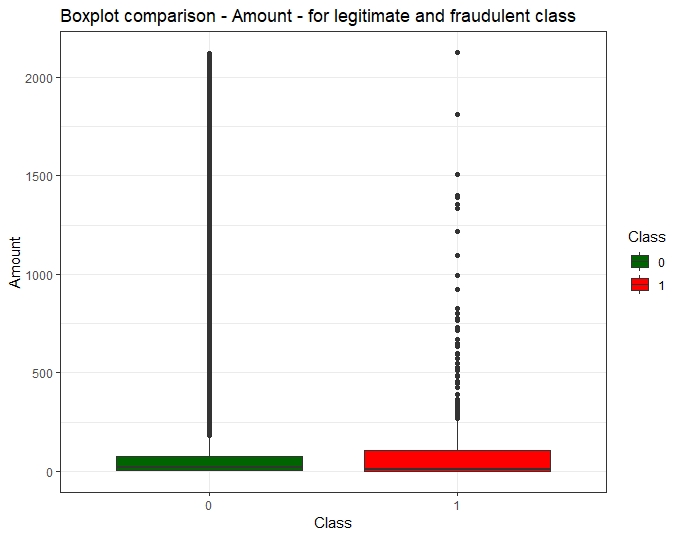
 In addition, the boxplot of Amount by Class displays the distribution for each class. It appears the distribution is different when it comes to minimum, first quartile, median, third quartile, and maximum.
Vi versus Class
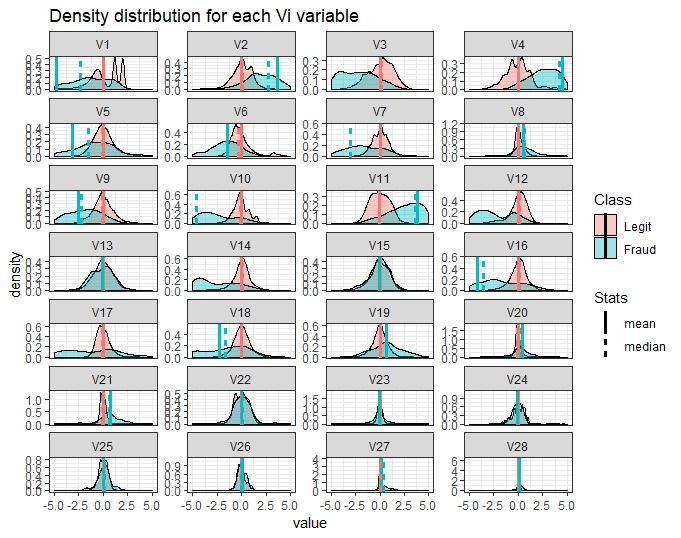
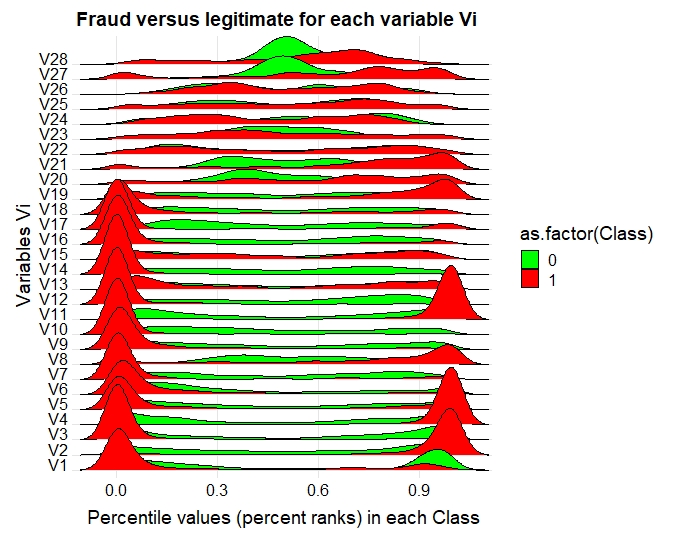
Comparing the various Vi versus Class using density curve and ranking with percentile values among Class, show the explanatory potential of Vi variables in regards with fraudulent transactions.
Correlations
As the main Vi variables are the results of a PCA, we do no expect them to be correlated and so we check if this assumption is confirmed and I have generated the Pearson correlation for the data. It is recommended to perform another correlation analysis once the data may be rebalanced.
This is the correlogram on the unbalanced dataset.
This correlogram shows most of the data Vi features are not correlated.
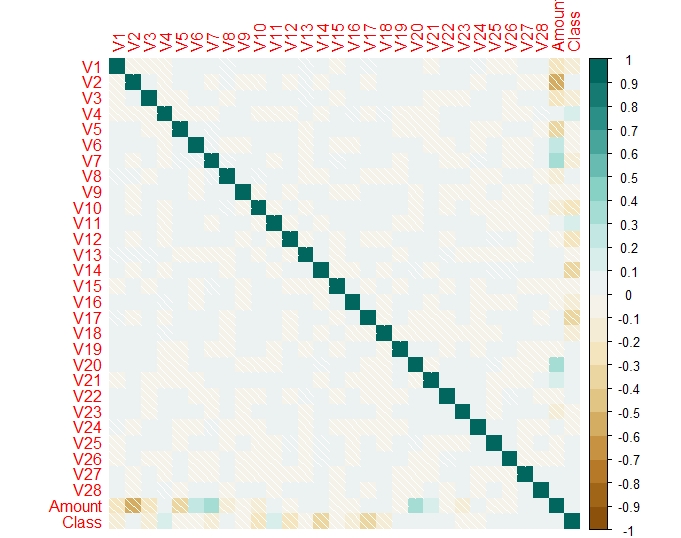 In addition, a correlation detection done with the package Caret, shows correlations between the “Amount” and “Class” features.
Summary of Exploratory Data Analysis
This exploratory data analysis highlighted the imbalance nature of the target class distribution, and the need to further prepare the training dataset, rebalancing it for modelisation and to normalise the Amount variable. As no additional information is provided for the Time Variable, it will be dropped for the rest of this project.
